
Beginner's Guide to Tableau: How Job Support Can Fast-Track Your Learning
What Is Tableau?
- Tableau is a tool that turns numbers into pictures and stories.
Easy to Use
- Tableau is simple, even if you’re not a data expert.
Works with Many Data
- It works with both small and big data.
- It can show data as it changes.

Interactive
- You can play with your data and ask questions.
Make It Yours
- You can choose colors and styles for your data pictures.
Sharing Made Easy
- You can share your data pictures online or on your phone.
What Can You Do with Tableau?
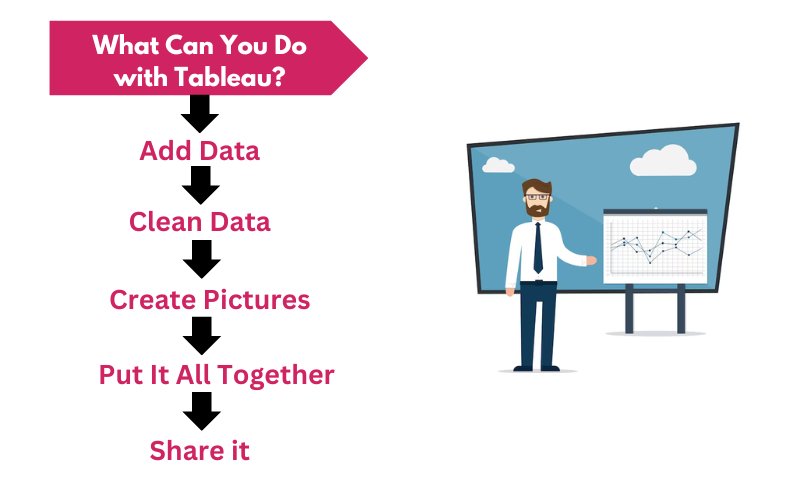
Add Data
- Put your data into Tableau from spreadsheets, databases, or the internet.
Create Pictures
- Combine many data pictures on one page to tell a big story.
Put It All Together
- Choose how to show your data, like bars or lines.
Clean Data
- Tableau helps make messy data neat and tidy.
Share It
- Share your data pictures with others so they understand your story.
Why Tableau Matters
- Tableau helps us make good choices using facts.
For example, stores use Tableau to know which toys sell best at holidays and buy more of them next time.
In Short
- Tableau turns tricky data into easy stories with colors.
- It’s easy to use and helps us understand data better.
- If you like stories with colors and pictures, Tableau is perfect for you.
Understanding Tableau: Making Your Data Space Fun and Simple
Welcome to Tableau!
Tableau is like a big playground for numbers. It has a friendly space where we can move things around easily, just like playing with toy blocks. The main area where we play and make our number pictures is called the “Workspace.”
Playing with Numbers the Easy Way
Tableau’s space is made to be super easy and fun. You don’t need to be a grown-up or a computer expert. With simple dragging and dropping, like moving our toy blocks, we can create amazing things. The best part? We don’t have to guess what to do. The “Show Me Pane” always has fun ideas for us!
What's in the Workspace?
Inside our big playground, there are a few special spots we should know about:
Shelves: Imagine shelves in your room where you put your toys. In Tableau, these shelves help us organize and sort our numbers. When we put numbers on these shelves, fun things start to happen!
Cards: Do you have favorite storybooks? Tableau has something like that called “cards.” These cards tell short tales about our numbers. They let us change how our number stories look and feel.
Show Me Pane: This is like our magic helper. Ever been confused about which toy to play with? The “Show Me Pane” is here to help! When we pick some numbers, this magic helper shows us the best ways to turn them into cool pictures. It’s like having a friend suggest the best game to play.
In Simple Words
Tableau’s workspace is like our fun and safe play area. It has special spots like shelves, cards, and a magic helper to make our number playtime amazing. With easy moves and friendly tips, anyone can create cool number pictures and stories. Let’s have fun and explore!
Before we can make cool pictures with numbers in Tableau, we need to find our numbers. These numbers come from places we call “data sources.”
Finding Our Numbers for Tableau
The First Step with Tableau
Where Do Our Numbers Come From?
Excel Sheets: You know those lists on our computers where we save things like chores or pocket money? Those lists are like Excel sheets. We often have numbers saved in them. Tableau lets us use these numbers to make our pictures.
SQL Databases: This is a bigger place for numbers. Imagine a big toy box with many different toy sets inside. SQL databases are like these big boxes but for numbers. Big places like schools or shops use them to save lots of details. With Tableau, we can look inside and pick the numbers we want.
Cloud-Based Platforms:Think of a special cloud where we can save our favorite songs or pictures. But, instead of songs, these clouds have numbers. They’re not in the sky but on the internet. Tableau lets us get numbers from these special clouds.
To Wrap Things Up
Starting with Tableau is like getting ready to draw. Before we draw, we need our colors. In Tableau, our colors are the numbers. We can get our numbers from our computer, big number boxes, or even special clouds on the internet. Once we have our numbers, we’re all set to make fun and colorful pictures!
Tableau's Number Boxes: Colors and Amounts
Getting to Know Tableau's Boxes
Tableau is like a big toy set with different boxes. Some boxes have colors, and some boxes tell us how many toys we have. In Tableau, these boxes are called “dimensions” and “measures.”
What's Inside These Boxes?
Dimensions (The Color Boxes): Dimensions are the names or types of things. Let’s think about a box of crayons. Each crayon has a name like “red,” “blue,” or “green.” In Tableau, dimensions are like crayon names. They help us know what things are called.
Measures (The Amount Boxes): If you have a toy collection, you might want to know how many cars or dolls you have. Measures in Tableau are like counting your toys. They tell us how much or how many.
Why Do We Need These Boxes?
Imagine drawing a picture. You’d want to know which colors to use and maybe how many stickers to put on it. In Tableau, the “colors” are our dimensions, and the “number of stickers” are our measures. When we use both boxes, we can make really cool number pictures. We can see things like which color crayon is used the most or how many toys are in each part of our collection.
In Simple Words
Tableau has two main boxes to help us play with numbers. One box gives us names or colors. The other box tells us amounts or sizes. When we use both these boxes, making number pictures becomes easy and fun!
Drawing Numbers with Tableau
What is Tableau?
Tableau is like a magic drawing book. But instead of drawing with pens or crayons, we draw with numbers. Let’s talk about the different ways we can do this.
Different Ways to Show Numbers
Bar Charts: Think about building with blocks. If you have more blocks, your tower is taller. Bar charts are like block towers. The taller the bar, the bigger the number.
Pie Charts: Imagine you have a big cookie. You split it into parts for sharing. Each part is a piece of the whole cookie. Pie charts in Tableau are like split cookies. They show us how numbers split into parts.
Heat Maps: Remember when it’s cold, and you touch a window? Some parts feel colder than others. Heat maps are like that. They use colors to show where numbers are big or small.
Scatter Plots: It’s like a game of dots. We put dots on a paper. Each dot is a number. We can see where numbers stand by looking at the dots.
Why Draw with Numbers?
We use numbers every day. Like when counting candies or telling time. But sometimes, numbers are too many or confusing. Drawing them makes it easier to see and understand. Just like a picture of a sunny day tells us it’s good to play outside, these number drawings help us know more about our numbers.
In Short
Tableau helps us draw our numbers. With it, we can see our numbers as towers, cookies, color spots, or dots. It’s a fun way to learn and share about numbers!
Tableau's Big Picture Board and Storytime
Tableau's Two Special Ways
Tableau has two cool ways to show numbers: a big picture board and a storybook. Let’s dive into what these mean.
Storybook (Stories)
Remember storytime ? A storybook takes us from the start to the end, one page at a time. In Tableau, this is called “stories.” It’s a journey with numbers. First, you might see a pie chart. Turn the page, and there’s a bar chart. Each page shows a new number picture. All these pages together tell a big story.
Big Picture Board (Dashboards)
Imagine a bulletin board in a classroom. This board can hold many things at once: a drawing, a note, a photo, and more. In Tableau, this board is called a “dashboard.” It shows many number pictures at once. So, in one glance, you see lots of info. It’s like seeing a whole zoo, not just one animal.
Why Use These Special Ways?
Having lots of numbers can be confusing. But with a dashboard, it’s all tidy in one place. It’s easy to see and understand. It’s like looking at one big picture made of small puzzles.
And for stories? Stories make learning fun. They help us see how numbers change and move. It’s like following a map on a treasure hunt. Each step brings a new clue.
In Simple Words...
Tableau lets us see numbers in two fun ways. The dashboard is like a big picture board with many things to see. Stories are like a book that takes us on a number adventure. Both ways make numbers more fun and easy to understand!
Making Sense of Numbers with Tableau's Tools
Sorting Like Toys
Groups (Putting Same Things Together)
If you have many toy cars, you might put all the red cars in one corner and the blue cars in another. That’s grouping. Tableau lets us do this with numbers. Say, if we sold many things, we can group all the apple sales together and banana sales in another group.
Filters (Picking What We See)
Think of a toy box full of toys. Now, imagine you only want to play with blue toys today. So, you take out only the blue ones. That’s what a filter does in Tableau. If we have many numbers, filters let us see only the ones we want. Like only the blue toys!
Sets (Our Special Choices)
Having lots of numbers can be confusing. But with a dashboard, it’s all tidy in one place. It’s easy to see and understand. It’s like looking at one big picture made of small puzzles.
And for stories? Stories make learning fun. They help us see how numbers change and move. It’s like following a map on a treasure hunt. Each step brings a new clue.
Why Use These Tools?
Numbers can be like a big pile of mixed toys. If we don’t sort them, it’s hard to find what we want. But with Tableau’s tools, it becomes easy. We can quickly find the numbers we’re looking for, just like finding our favorite toy.
To Wrap Up
With Tableau, sorting numbers is as fun as sorting toys. Filters, groups, and sets help us see our numbers in a neat and clear way. It’s like making playtime easier and more fun!
Learning Tableau at Work: Friends Make It Easier
Starting Out
Learning something new is like starting a puzzle. At first, the pieces are all over. But with friends and tools, the pieces come together faster.
The Helpful Friend: Mentorship
Think of mentors as your older siblings. They’ve done what you’re trying to do.
They’ve Been There: Mentors know the hard parts. They help you skip mistakes.
Quick Tricks: Mentors show fast ways to do things in Tableau. It’s like knowing a shortcut in a game.
Why We Use It: With a mentor, you see how Tableau helps in real jobs.
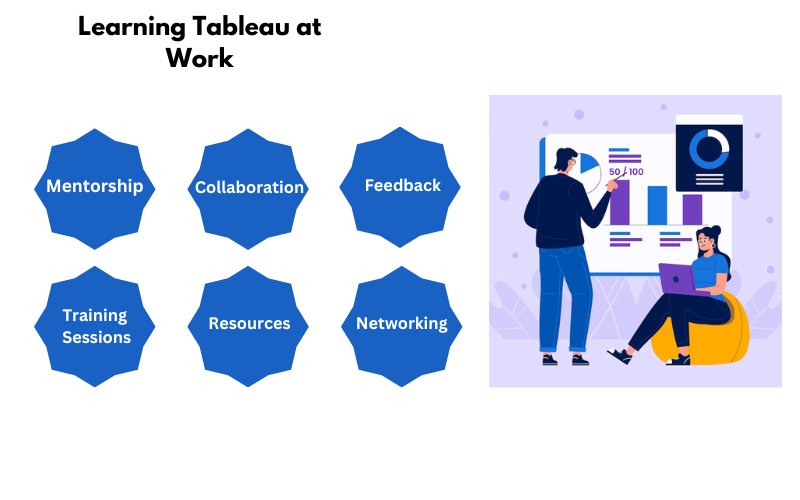
Team Up: Collaboration
Working together is like building something with friends. Everyone adds a part.
Many Ideas: In a group, you get different ideas. It helps see things you might miss.
Different Ways: Everyone uses Tableau their way. Watching them helps you learn more.
Class Time: Training Sessions
Some jobs have Tableau classes. They help you learn step by step.
A Clear Path: These classes have a plan. You learn everything you need.
Learn From the Best: Experts teach these classes. They help you avoid mistakes.
Trying It Out: Practical Experience
You learn best by doing. Using Tableau in real tasks shows you its power.
Real Tasks: At work, the data is real. Solving problems feels good.
Seeing Change: When you make a report that helps, it shows Tableau’s value.
Handy Tools: Resources
Having the right tools makes any job easier. Resources help you when you’re stuck.
Guides: There are books and videos that help. They’re like helpful friends.
New Things: Tableau changes. Resources help you keep up.
Getting Better: Feedback
Feedback is like a coach’s advice. It shows you where to improve.
What’s Missing: Maybe you missed something. Feedback shows it.
Doing It Better: Each feedback helps you get better next time.
Meeting More Friends: Networking
Meeting others helps you learn. They share their stories and tips.
We’re in It Together: Others are learning too. They have stories to share.
What’s Next: Some people know more. They tell you about the next steps.
Wrapping Up
Learning Tableau with friends at work is fun. Mentors, teamwork, real tasks, feedback, classes, tools, and new friends help you. You’re not just learning; you’re growing with others.
Embark on your Tableau journey with our Beginner’s Guide to Tableau, unraveling the magic of data visualization. Learn the basics, from creating simple charts to complex dashboards, and witness the power of transforming raw data into meaningful insights. Feeling stuck? Explore the benefits of Tableau Online Job Support to fast-track your learning. Our expert support ensures you overcome hurdles and progress seamlessly in your Tableau exploration. Ready to elevate your skills? Click here for Tableau Online Job Support and experience a smoother learning curve.